Sports Science - Physics
2026-03-02
Energy & Training
Homeostasis
optimum temperature
optimum pH
optimal glucose levels
etc
Adaptations
overload principle
specificity
reversibility
individuality
Calorimetry
Direct: measure heat produced during exercise - Human Calorimetry Chamber
Indirect: measure O2 consumption (VO2) typically about 0.25mL/kg/s of VO2 during exercise 0.05mL/kg/s of VO2 during rest
Maximum VO2 measured by exercising to exhaustion get up to 1mL/kg/s
corresponds to about 2000 Watts of power
training will increase your VO2 max
cardiovascular adaptations giving better O2 delivery
muscle mitocondrial O2 utilisation
athletes using large muscle masses for extended periods tend to have highest VO2 max
Respiratory Exchange Ratio (RER)
as well as measuring O2 levels we also monitor CO2 gives us the RER \[ RER = \frac{V_{CO_2}}{V_{O_2}} \] This gives information on type of food being used
for fats, RER = 0.7
for glucose, RER = 1.0
Fats, e.g. palmitate, C16H32O2 + 23 O2 -> 16 CO2 + 16 H2O \[ \frac{16}{23} = 0.70 \] Glucose, C6H12O6 + 6 O2 -> 6 CO2 + 6 H2O \[ \frac{6}{6} = 1.0 \]
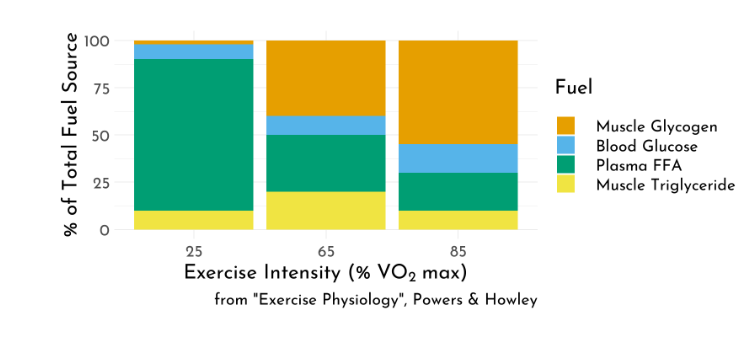
Fuel depends on Type of Exercise
for long distance, endurance, RER lets us deduce that mostly fats are burned
for high-powered activities like sprinting, mostly carbohydrates
CHO’s needed at higher intensities
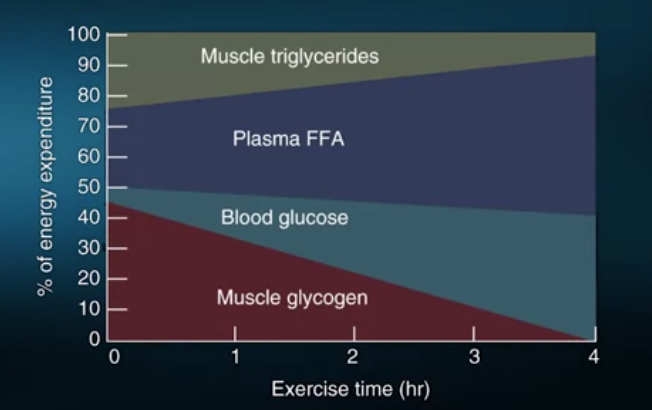
Fuel used During a Marathon
muscle triglycerides: provide ~ 30% of energy initially but fades to ~10% gradually over four hours
plasma FFA: provide ~ 20% initially but this grows to 50% over four hours
blood glucose: provides 10% initially, this grows to 40% after four hours
muscle glycogen: provides ~ 40% initially but fades out over about 3 hours
decrease in CHO use leads to a decrease inperformance and to the onset of fatigue
See this video for a discussion of energy use in sled dogs.
Fuel used During a Marathon
Crossover Concept
As exercise intensity increases
progressive decrease in fats as fuel source
progressive increase in CHO as fuel source
Training adaptation - push this crossover point to higher intensities
Leads to sparing of precious CHO stores
Pushes back onset of fatigue
ATP & Muscle Work
Only ATP can be used to directly cause muscle contraction
Breakdown of ATP allows crossbridge formation between actin and myosin (enzyme ATPase)
Amount of ATP in muscle is extremely low
During exercise as ATP utilisation goes up, need to replace it
\[ ATP_{prod} = ATP_{util} \] ATP producing pathways turns on by the energy charge in the cell \[ Energy\; Charge = \frac{[ATP] + {1\over2} [ADP]}{[ATP] + [ADP] + [AMP]} \] At rest, the energy charge in muscle is about 0.85 As energy charge decreases, ATP producing pathways are turned on while ATP utilising pathways are turned off
Mitochondria
Oxidative production of ATP occurs in mitochondria.
This is vast majority of ATP production.
- Aerobic activity
- For exercise lasting minutes or longer
- shorter bouts of exercise use anaerobic pathways for ATP production
Anaerobic Sources of Energy
Activities lasting seconds need energy immediately Access stores of ATP in the cell
\[ ATP + H_2O\; \rightarrow\;ADP + P_i \qquad ATP_{ase} \]
\[ CP + ADP\; \rightarrow \; ATP + C \qquad creatine\; kinase \] No \(O_2\) in either process
About 3 or 4 times more CP than ATP in cell.
Carbohydrates
Carbohydrate can be broken down anaerobically
\[C_6H_{12}O_6\; \rightarrow\; 2 ATP + 2\; lactate \] Or aerobically
\[C_6H_{12}O_6 + 6O_2\; \rightarrow\; 30ATP + 6CO_2 + 6H_2O\] (note, for the same glucose molecule we get 15 times more ATP when broken aerobically) Limited amount of carbohydrate in the body, aerobic metabolism helps preserves carbohydrate stores.
Fats can also be broken down aerobically \[Palmitate + 23O_2\;\rightarrow\;108ATP + 16CO_2\]
Carbohydrate Storage
Carbohydrates stored as Glycogen
Glycogen = strings of glucose attached to each other
When glucose needed, peeled off from glycogen
Muscle Glycogen
- typically 400g = 1600kCal
- this is ~90mM/kg of muscle
- can be depleted in minutes
- carbohydrate loading: supercharges muscles with up to 250mM/kg of muscle
- useful for exercises of > 90 minutes
Liver Glycogen
- typically 100g = 400kCal
- needed to maintain blood glucose levels
Blood
- typically 3g = 12kCal (i.e. not very much)
Total of 2000kCal can be depleted during endurance exercise This isn’t very much (gets depleted).
Compare to Fat Storage
Adipose Tissue
- typically 12kg = 108,000kCal
- fifty times more energy than carbohydrates
- key aerobic training adaptation is being able to use fat stores
- this preserves carbohydrate stores
To What Extent do we use Carbohydrates?
Intensity and duration of exercise
at low intensities use fats
at high intensities use carbohydrates
at high intensities use mostly type II muscle fibres
Type of activity
Crossover Concept
Nutritional status
Different Muscle Fibres
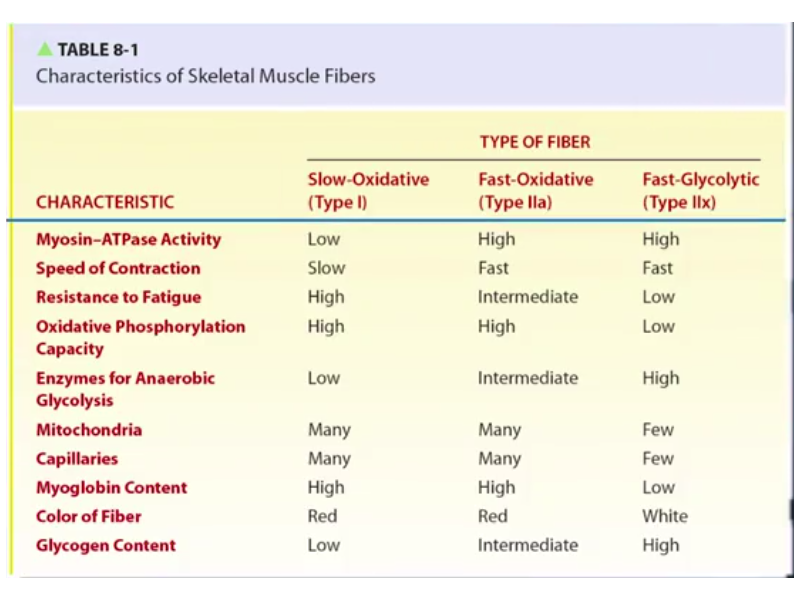
Muscle Fibres
Getting CHO from Glycogen
glucose molecule stripped off by glycogen phosphorylase.
prompted by release of epinephrine or by Ca++ in muscle.
at high exercise intensities, muscle glycogen can drop from 90mM/kg to less 20mM/kg in minutes.
- using mostly type II muscle fibres
Liver Glycogen
provides glucose for blood glucose levels
necessary to avoid exercise induced hypoglycemia
muscle uptake from blood is up to 50mM/min
normal liver glucose levels are about 4mM/L (about 5L of blood in human body)
Carbohydrate Loading
increase CHO content in muscles prior to exercise
can get up to 250 mM/kg of muscle
(compare to 90 mM/kg normally)
increase CHO intake in week prior to exercise
roughly double it to ~0.6kg/day
rest for day or so before exercise
Carbohydrate Feeding
consumption of very dilute CHO drink during exercise
athletes at 70% VO2 max can exercise for ~4 hours rather than 3 hours before fatigue
gives addition source of CHO thus sparing liver glycogen
Training Adaptations
sedentary individuals can double their cell mitochondrial content through training
takes several weeks
means using more CHO aerobically rather than anaerobically
as we’ve seen, this is more more efficient
spares muscle CHO content
also observe a lower RER for individuals after training
lower RER means greater fat usage
this happens at all VO2 % levels
Carbohydrate Summary
exercise intensity and fibre recruitment determine CHO utilisation
we have limited CHO stores (mostly in muscle)
liver glycogenolysis maintains blood glucose
carbohydrate loading increase muscle glucose levels before exercise
carbohydrate feeding maintains blood glucose during exercise
Fat Metabolism During Exercise
free fatty acids are immediate source of energy
fats must be converted to FFA’s before being used
FFA’s are hydrocarbon chains that can readily be oxidised in mitochondria
FFA’s stored in the form of triglycerides
triglycerides stored in adipose tissue (mostly) or skeletal muscle
Fat Usage During Exercise
- during prolonged exercise, more energy harvested from adipose fats
- decrease in use of CHO’s and muscular triglycerides
- in contrast, as exercise intensity increases, less energy from adipose stores
- crossover concept
- training adaptations for endurance:
- greater ability to rely on fat energy stores at any exercise intensity
- greater carbohydrate sparing
Fats Summary
FFA for direct ATP production
triglycerides are storage form
vast bulk of fat storage in adipose tissue ( > 100,000 Cal)
some fat storage in muscles (~ 3000Cal)
fats are preferred fuel at low exercise intensities
training adaptation is better use of fats
Protein Metabolism
proteins made from amino acids
to be used as fuel (contribute ~10%), proteins must be broken down to constituent AA’s
some AA’s used directly as fuel, others converted to CHO and fat
Nitrogen balance - protein intake
- positive for growing children and intense weight training
typical adult diet ~ 60g protein / day
- double this for endurance training
- triple it for strength training
Muscle Protein Synthesis
- decreases during exercise
- energy charge drops - inhibits synthesis
- but significantly increases post exercise
- increase protein intake 1 hour post exercise
Body Adaptations to Exercise
Muscular
Respiratory
Cardiovascular
Endocrine
Immune
Muscle
- 3 types of muscle
- cardiac
- skeletal
- smooth (e.g. around blood vessels)
Skeletal Muscle
- contractions
- isometric
- concentric (most common type)
- eccentric (main source of muscle soreness after exercise)
Different Muscle Fibres
- Type IIx
- fast
- few mitochondria
- anaerobic
- sprinting / weight lifting
- 2 minutes
- Type IIa
- fast/moderate
- medium mitochrondria
- mixed aerobic / anaerobic
- 10 minutes
- Type I
- slow
- many mitochondria
- aerobic
- distance running / swimming / cycling
- hours
Fibre Composition in Athletes
- distance runners
- 75% Type I
- 25% Type II
- sprinters
- 25% Type I
- 75% Type II
- non-athletes
- 50% Type I
- 50% Type II
Respiratory System
- functions
- manage arterial \(O_2\) pressure
- manage \(CO_2\) pressure
- control pH during exercise
\(O_2\)
- haemoglobin in red blood cells carry \(O_2\)
- increase in red blood cells due to endurance training (also blood doping)
\(CO_2\)
- \(CO_2\) produced metabolically
- aerobic break down of CHO, fats, etc
- \(CO_2\) also produced non-metabolically
- buffering of acids
\[H^+ + HCO_3\;\rightarrow\;H_2CO_3\;\rightarrow\;CO_2\; +\;H_2O \] - stops muscles and blood getting too acidic
Increase in Respiration during Exercise
increase tidal volume
increase breathing rate
at rest
- 12 breaths / min \(\times\) 0.5 L/breath = 6 L/min
maximal exercise
- 48 breaths / min \(\times\) 4 L/breath = 192 L/min
most efficient to increase tidal volume
Control of Respiration
initially neural control
later humoral (blood chemistry) control
Cardiovascular System
- response to exercise
- heart pumps harder
- blood vessels to muscles dilate (double blood flow)
- decrease blood flow to other organs
\[Cardiac\;Output\;=\;Heart\;Rate\;\times\;Stroke\;Volume\]
Heart rate increase
reduce parasympathetic nerve activity
increase sympathetic nerve activity
increase epinephrine
heart rate from 40bpm to 180bpm
stroke volume 100 to 150 mL / beat
endurance athletes can get up to 50 L/min (at 5L/min \(O_2\) consumption)
Arteriovenous Oxgen Delivery
measures efficacy of blood in delivering \(O_2\)
get about 6mL of \(VO_2\) for every 100mL of blood at rest
increases to 20mL of \(VO_2\) for every 100mL of blood at \(VO_2\:max\)
Cardiac Output
- at rest
- 6 L/min
- 20% to skeletal muscles
- during intense exercise
- 25 L/min
- 90% to skeletal muscle
- dramaticaly decrease % to gut, kidneys, etc
- maintain flow to brain
Blood Pressure
systolic blood pressure can double during intense exercise
diastolic pressure doesn’t change much
Cardiac Training Adaptations
lower heart rate at rest and at submaximal exercise
greater stroke volume at rest and submaximal exercise
greater maximal cardiac output (due to increased stroke volume)
increased arteriovascular \(O_2\) difference
- increased red blood cells
- more capillaries in muscle
- more mitochondria
maximum heart rate doesn’t change
Endocrine System
- Pancreas
- release of insulin (glucose uptake from cells)
- release of glucogon (replenish glucose in blood from liver)
- Adrenal
- epinephrine and norepinephrine
- Pituitary
- growth hormone
Endocrine Training Adaptations
- exercise increases bodies insulin sensitivity
- directly addresses type II diabetes
- epinephrine and norepinephrine increase during exercise
- regulated by sympathetic nervous system
- fight or flight response
- increase heart rate, stroke volume, fat mobilisation, glycogen breakdown
- growth hormone
- increase protein synthesis and FFA utilisation
- slow but large increase in GH post exercise
Immune System
- immune system suppressed for hours post intense exercise
- reduce both antibodies and T-cells
- epinephrine and cortisol both immunosuppressants
Training Adaptations
endurance training
strength training
For endurance training
- frequency
- 3 to 5 times per week
- intensity
- 60% - 80% of cardiac reserve (heart rate)
- duration
- 20 to 60 minutes continuous aerobic
- mode
- large muscle groups
For strength training
- frequency
- 5 times / week, sometimes split routines
- intensity
- 70% of one repetition maximum (1-RM)
- no of sets
- 3 sets
- repetitions
- 10 per set
get neural adaptations first, follwed by muscle hypertrophy
genetics, nutrition, environmental factors all play role
percentage strenght gain same for men and women
- though more testosterone in men
Nutritional Requirements - Eudurance
- how much to eat
- maintain energy balance
- what to eat
- ~60% CHO (endurance)
- when to eat
- to replenish CHO stores, best within 1-2 hours post exercise
- increased insulin sensitivity
- pre competition - 3 hours before, 500 Calories or less, mostly CHO
- maintain hydration during exercise
- plasma volume
- temperature regulation
Nutritional Requirements - Strength
muscle protein synthesis > protein breakdown
resistance training + high protein diet
double protein intake to 1.6kg / kg body weight
ingest protein in first hour post training
- easily digested proteins (e.g. whey) ideal
Causes of Muscle Fatigue
causes diverse, but mostly in the muscle
depends on type of muscle fibre
Fatigue for Short High Intensity Exercise
depletion of ATP and PCr
increased muscle acidity
- \(H^+\) interferes with \(Ca^{2+}\)’s role in muscle contraction
- also inhibits anaerobic glycolysis
- buffering (e.g. \(NaHCO_3\))
Fatigue for Endurance Exercise
decrease in muscle and liver glycogen
decrease in intra-muscular calcium
higher body temperature
- more blood to skin for cooling
Causes of Muscle Soreness
- muscle soreness felt during and immediately after exercise
- localised pain and burning
- prolonged isometric contraction
- muscle tension causes local blood flow to collapse
- interupts \(O_2\) delivery
- increase reliance on anaerobic production
- increased acidity
- activate pain receptors in muscle
- subsides rapidly after exercise stops
- muscle cramps and spasms
- electrolyte imbalance caused by dehydration and temperature increase
- makes neuromuscular junction more excitable
- altered neuromuscular control
- motor neuron fires involuntarily
- strecthing golgi tendon organ inhibits motor neurons
- muscle stiffness felt 8-48 hours post exercise
- delayed onset muscle soreness
- after performing novel type of exercise
- caused by eccentric muscle contractions
- fewer fibres recruited for these actions
- greater force per fibre leads to micro-trauma
- leads to inflammation and tenderness
- not due to lactic acid (lactic acid quickly flushed after exercise)
- dead muscle removed and replaced over days
Performance Enhancing Drugs
- ergogenic techniques
- anabolic steroids
Strength - Anabolic Steroids
- along with heavy resistance training and high protein diet
- but without androgenic effects
- administered orally and injected
- stacking and pyramiding
- enter nucleus and alter gene expression
- serious health consequences
- cancers
- psychological effects
- etc
- also growth hormones
- similar chemical structure to testosterone
Performance Enhancing Drugs - Endurance
- blood doping
- \(O_2\) delivery - endeavours near \(VO_2\:max\)
- increase red blood cell concentration and blood volume
- red blood cell reinfusion
- high altitude exposure
- EPO (hormone secreted by the kidneys that promotes red blood cell production in the bone marrow). Can lead to blood clots
Caffeine
greater mental alertness
greater fat mobilisation
greater time to exhaustion
also interacts with \(Ca^{2+}\) from SR
Exercise in Health and Disease
dieting and weight control
heart disease
diabetes
cancer
successful aging
mental health
Health Dangers
low fitness
smoking
systolic BP > 140mmHg
Cholesterol > 6.2 mM / L
BMI > 27
even low levels of exercise are beneficial
Diet, Weight Control, and Exercise
culprit is adipose cells that store fat
measures of body composition
- DEXA (gold standard)
- skin fold calipers along with hip and waist measurements
- bio-electrical impedance
- BMI (pretty crude)
Types of Body Fat
- Upper body obesity
- primarily adominal region
- greater health risk
- visceral fat within abdominal cavity surrounding liver, pancreas, intestines, etc
- Lower body obesity
- primalily hips and thighs
- lower health risk
- sub-cutaneous
Metabolic Syndrome
- increased risk for
- heart disease
- stroke
- diabetes type II
- symptoms such as
- increased bloop pressure
- high blood glucose
- abnormal blood cholesterol levels
Dieting
- dieting alone
- initial weight loss due to water
- followed by significant loss of fats
- but also protein, so loss of skeletal muscle
- exercise alone
- number of Calories burned is relatively small
- but even is weight loss is minimal, health gains can still be significant
Heart Disease
atherosclerosis
- deposition of plaques of fat on inner walls of arteries
LDL is major culprit here
- exercise helps swap HDL for LDL
heart attacks and stroke
exercise reduces both systolic and diastolic BP
physical activity addresses many of the risk factors
Exercise and Diabetes
- type II diabetes linked with obesity (visceral fat)
- insulin resistance
- normal blood sugar < 5.5 mM/L
- prediabetic < 7mM / L
- diabetic > 7mM / L
- symptoms
- thirst
- frequent urination
- fatigue
- slow healing sores and frequent infection
- blurred vision
- loss of peripheral sensation
Cellular Mechanism of Diabetes
insulin resistance
insulin receptor in cell wall opens GLUT4 glucose channel
in diabetes, signal between insulin receptor and glucose channel is compromised
single bout of exercise reduces blood glucose
regular exercise increases glucose sensitivity in muscle
- both for endurance and strength training
Exercise and Cancer
lower risk of some cancers, and helps treatment
has shown exercise reduces risk for breast, colon, prostate,
lungcancersexercise enhances natural immunity
increase levels of anti-oxidants
lowers obesity
retards growth factors implicated in cancer such IGF-1
Exercise and Aging
as we’ve seen, exercise addresses many health issues that arise in aging
balance, strength, flexibility, endurance
\(VO_2\;max\) declines with age, exercising mitigates this
- athletes 75 mL / kg / min to 45 mL / kg / min at age 75
- sedantary 40 mL / kg / min to 26 mL / kg / min at age 75
- and never too old to start
Sarcopenia
- loss of muscle mass with age
- can lose %10 per decade
- effects strength, balance, etc
- also impacts bone density
- training adaptations we’ve discussed before will also occur in older people
Osteoporosis
loss of calcium from bones
bone is similar to muscle in that when overloaded it will adapt and strengthen
weightlifting especially beneficial
Exercise and the Brain
increase cognitive function
decrease risk of dementia
decrease risk of Alzheimer’s
decrease risk of Parkinson’s
reduce depression, stress, anxiety
Healthy Brain
regular exercise
healthy diet
quality sleep
active social life
stress management
mental stimulation
Brain Activity
blood flow can increase by up to 20% during exercise
- mitigates vascular degeneration in the brain
pretty much all brain areas
increased blow (and CSF) flow reduces build-up of \(\beta\) amyloid plaques (AD)
exercise promotes dopamine, benefits people with Parkinson’s
References
Exercise Physiology: Theory and Application to Fitness and Performance. S.K. Powers and E.T. Howley. 10th edition. McGraw Hill publishers.
Exercise Physiology: Nutrition, Energy, and Human Performance. W.D. McArdle, F.I. Catch and V.L. Catch. 7th edition. Lippincott Williams & Wilkins publishers.
Biochemistry for Sport and Exercise Metabolism. D. McLaren and J. Morton. 1st edition. Wiley-Blackwell
Science of Exercise (University of Boulder, Colorado) - https://www.coursera.org/learn/science-exercise/